Insightful visualisation of Open Source Intelligence (OSINT)
RED has launched a new service, RED Visual Intelligence (RED-Vi), for managers who need to collect, analyse and interpret frequently changing data feeds with minimum effort and for maximum insight.
Hosted on a secure server, RED-Vi provides a web-based service to automatically harvest, parse, clean, consolidate, visualise and explore open source data from multiple sources and in different formats, saving time, effort and cost. Designed around the Military Intelligence Cycle, interactive visualisations are explicitly focussed on supporting decision makers, and so, better decision making.
RED-Vi combines our established Open Source Intelligence (OSINT) gathering and analysis capability with bespoke interactive dashboard visualisation. It is based on:
- Proprietary software to target, gather, fuse and prioritise data from almost any open source – whether internal to an organisation or from across the Surface, Deep or Dark web – and present it for expert assessment;
- Deep experience of the proven Military Intelligence Cycle (Direct / Collect / Process / Disseminate) to ensure that data collection and analysis are aligned with the most important business needs;
- Good practice in the design and implementation of powerful interactive visualisations to draw attention to key trends, opportunities or risks;
- Established analytics, modelling and OR capability to extend interpretation of the data into the realms of forecasting and “what-if?” analysis.
RED-Vi is relevant to all organisations and businesses, even countries, concerned about what’s going on around them. Maybe it’s an essential part of what they do – such as monitoring unregulated pharmaceutical sales – or needed for Horizon Scanning to spot and understand emerging threats and risk. An example is the current global pandemic, where RED has developed a prototype COVID-19 UK Tracker to highlight regional trends and risks cross the UK.
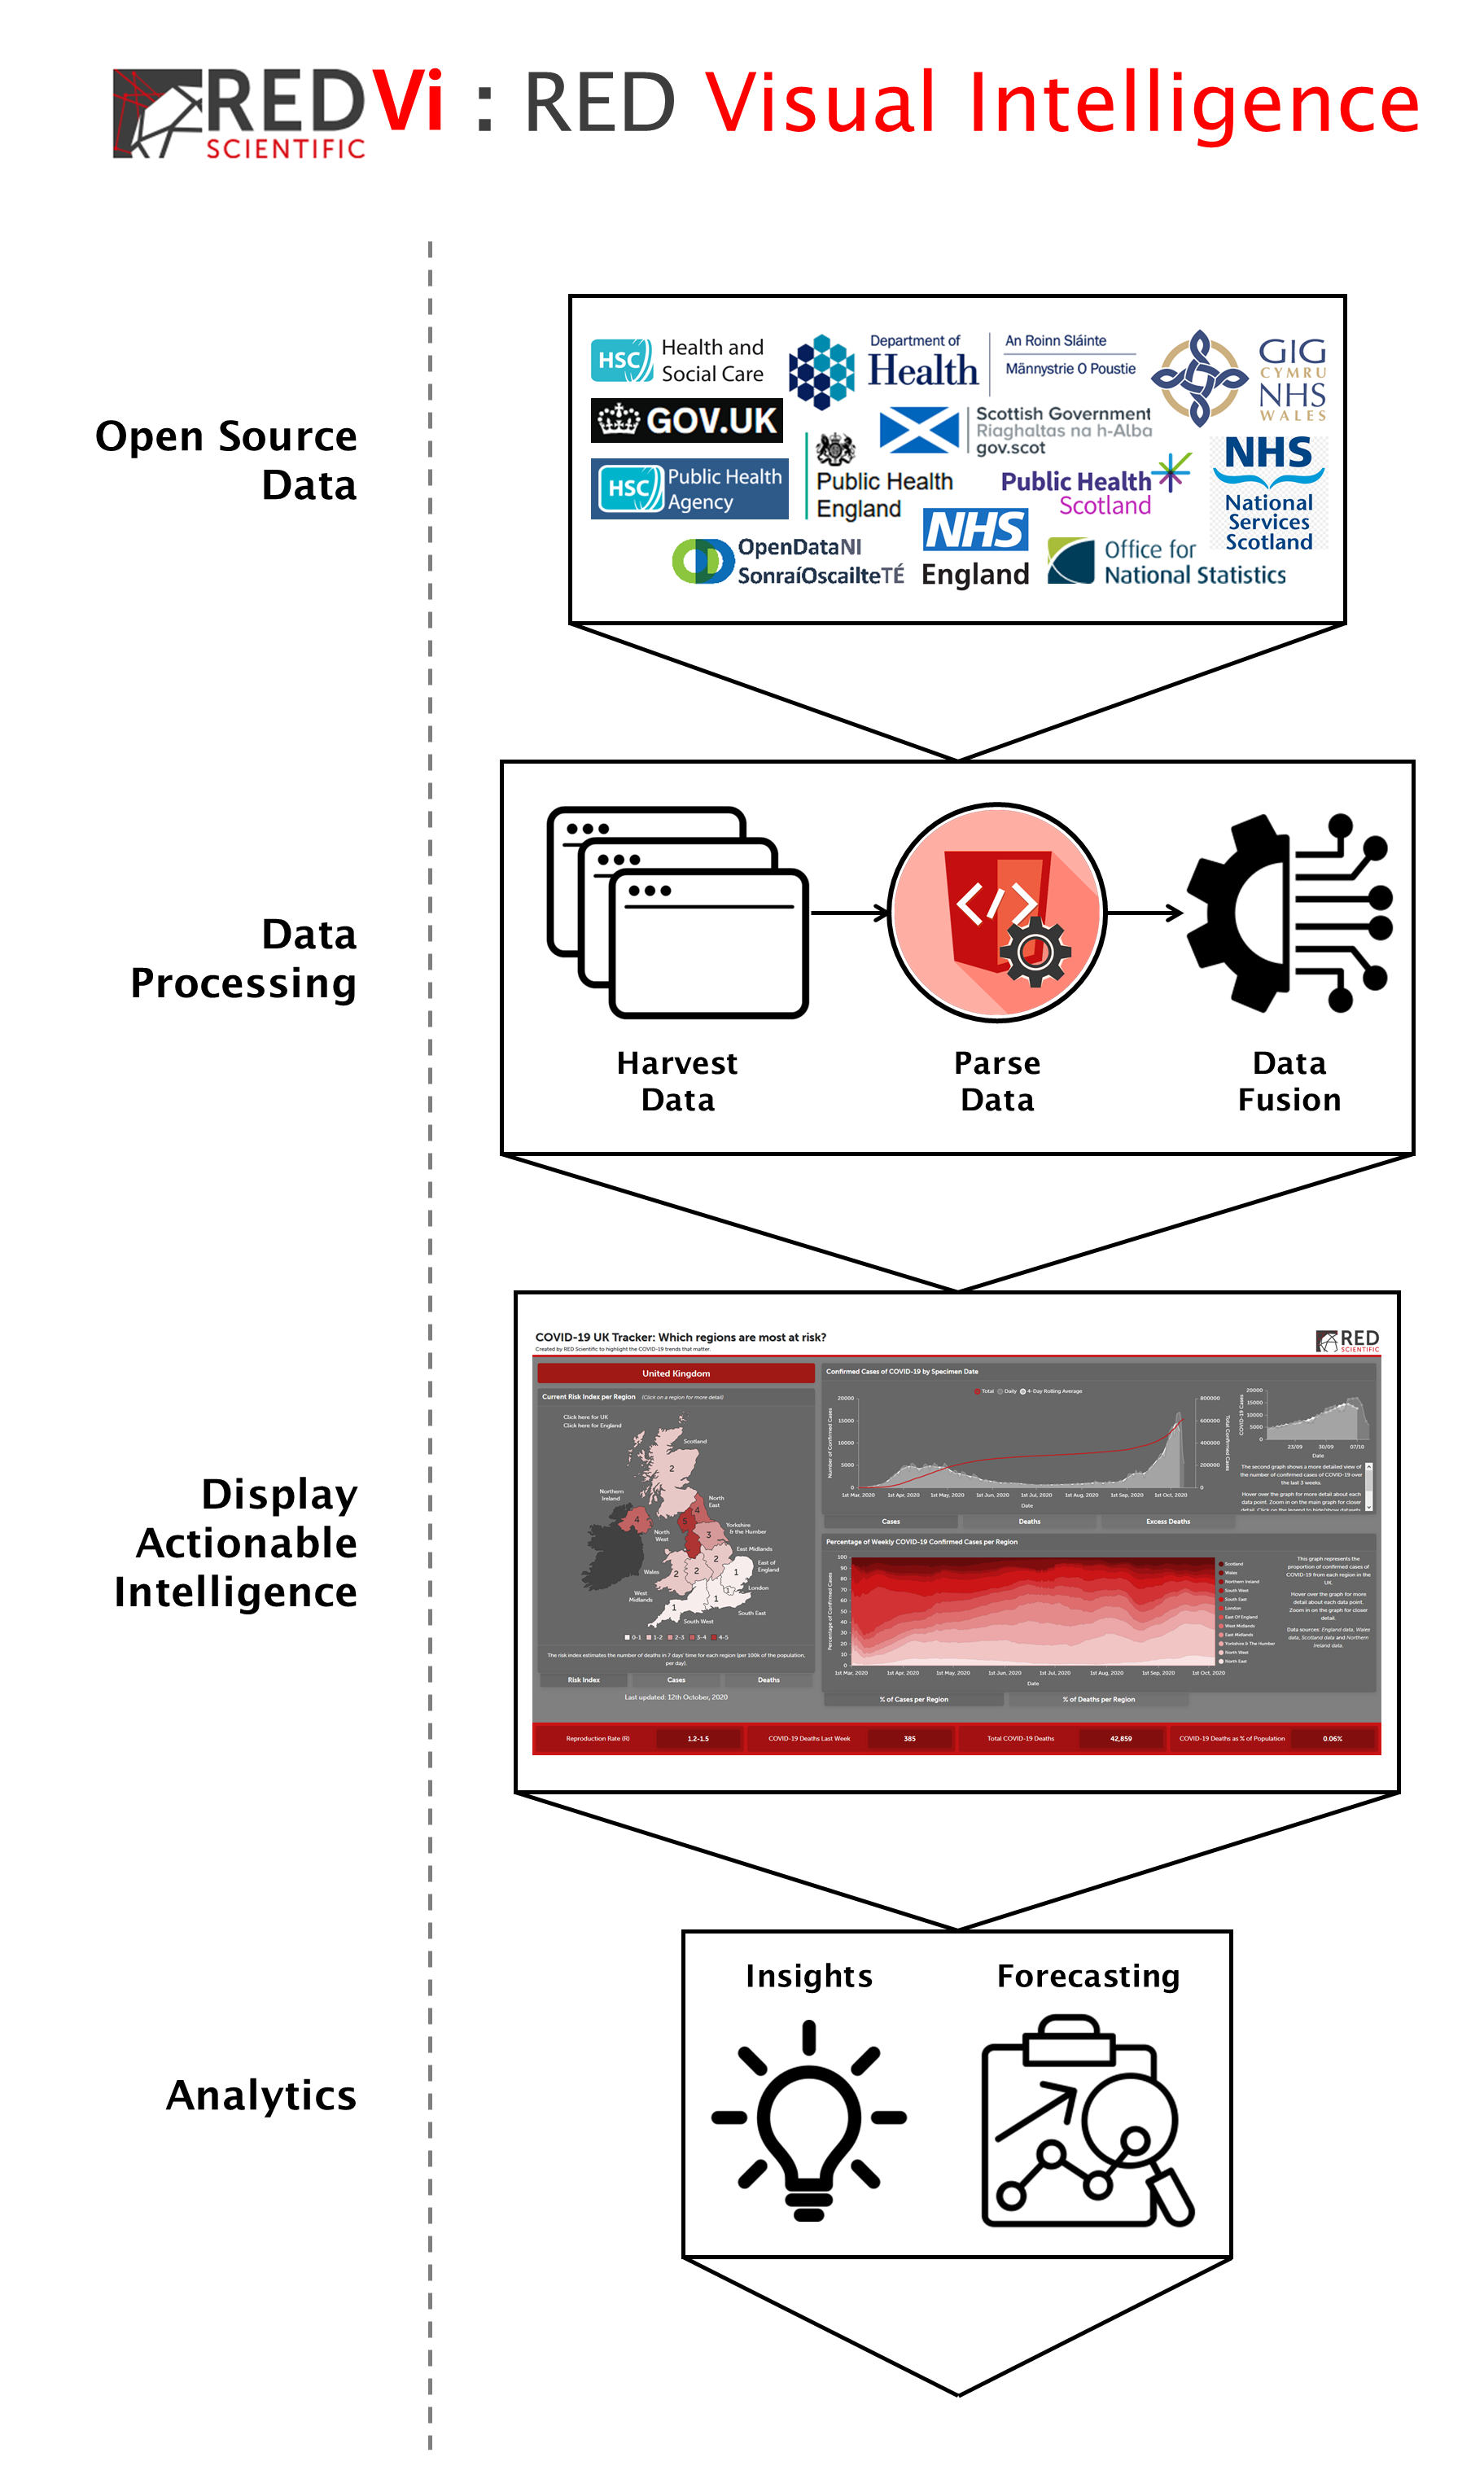
RED-Vi implementation stages:
- Open Source Data – Open source data is harvested via web scraping (in the case of the COVID-19 UK Tracker, data on cases, deaths, hospitalisations, tests, R rate, and excess deaths is captured from UK government sources each evening, just after 6pm).
- Data Processing – The harvested data is parsed, checked for completeness and errors – including those arising from data format or location changes. If the data streams are clean, they are consolidated into a suitable format for analysis and visualisation (in the case of the tracker, a JSON file).
- Display Actionable Intelligence – The latest data is turned into an interactive, web-based, visual format designed to highlight important trends (in the case of the tracker, a dashboard web page: www.red-scientific.co.uk/covid-19-dashboard).
- Analytics – Adds an extra dimension of insight by applying forecasting or statistical algorithms / models to the data (in the case of the tracker, an indicative Regional Risk Index is calculated, based on trends in COVID-19 cases).
Other successful demonstrations of the RED capability are the Horizon Scanning System for a global media business and the Regulatory Surety Compliance (RISC) tool which scans the web for fake and illegal medicines.
The COVID-19 dashboard is being updated iteratively with additional data streams and in response to suggestions for improvements from users.
To find out more about the RED-Vi service or the COVID-19 dashboard please contact us at dashboard@red-scientific.co.uk or via our contact page.