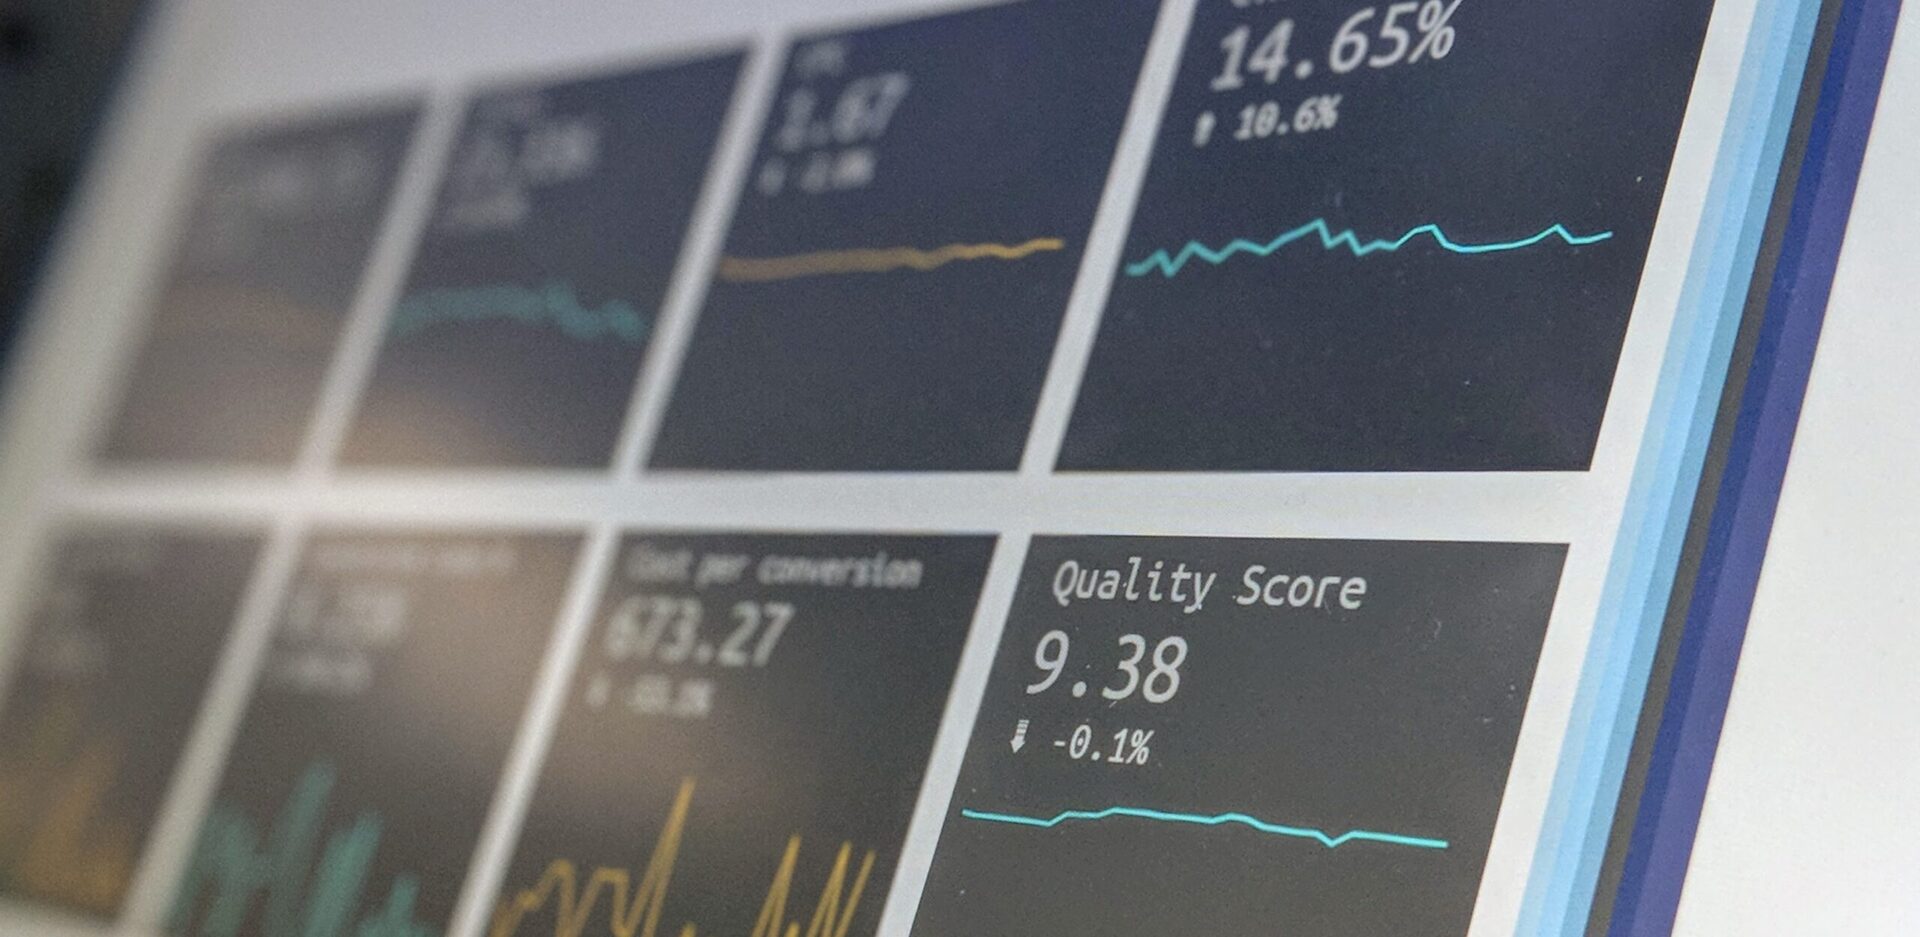
RED Scientific are delighted to announce a new service that we are offering: RED-Vi (Visual Intelligence) – for turning real-time open-source data into insightful visual information.
RED-Vi combines our established Open Source Intelligence (OSINT) gathering and analysis capability with interactive dashboard visualisation.
This service is for managers who need to collect and analyse frequently changing data from multiple sources without spending a large amount of time scraping, cleaning, merging and visualising datasets.
Hosted on a secure server, RED-Vi provides a web-based service to automatically gather, process, visualise and explore open source data from multiple sources and in different formats, saving time, effort and cost. Designed around the Military Intelligence Cycle, interactive visualisations are explicitly focussed on supporting decision makers, and so, better decision making.
To demonstrate this service, RED has published the beta version of a COVID-19 UK tracker. You can see this in action here.
If you think your organisation might benefit from the RED-Vi service, please contact us at dashboard@red-scientific.co.uk to arrange an informal discussion.


