Challenge
RED Scientific has developed a suite of in-house capabilities, including:
- Open Source Intelligence (OSINT) harvesting
- Data processing and dissemination
- Analytical tools
- Modelling techniques
- Data visualisation
The challenge was to demonstrate these capabilities in a compelling, real-time web application.
Approach
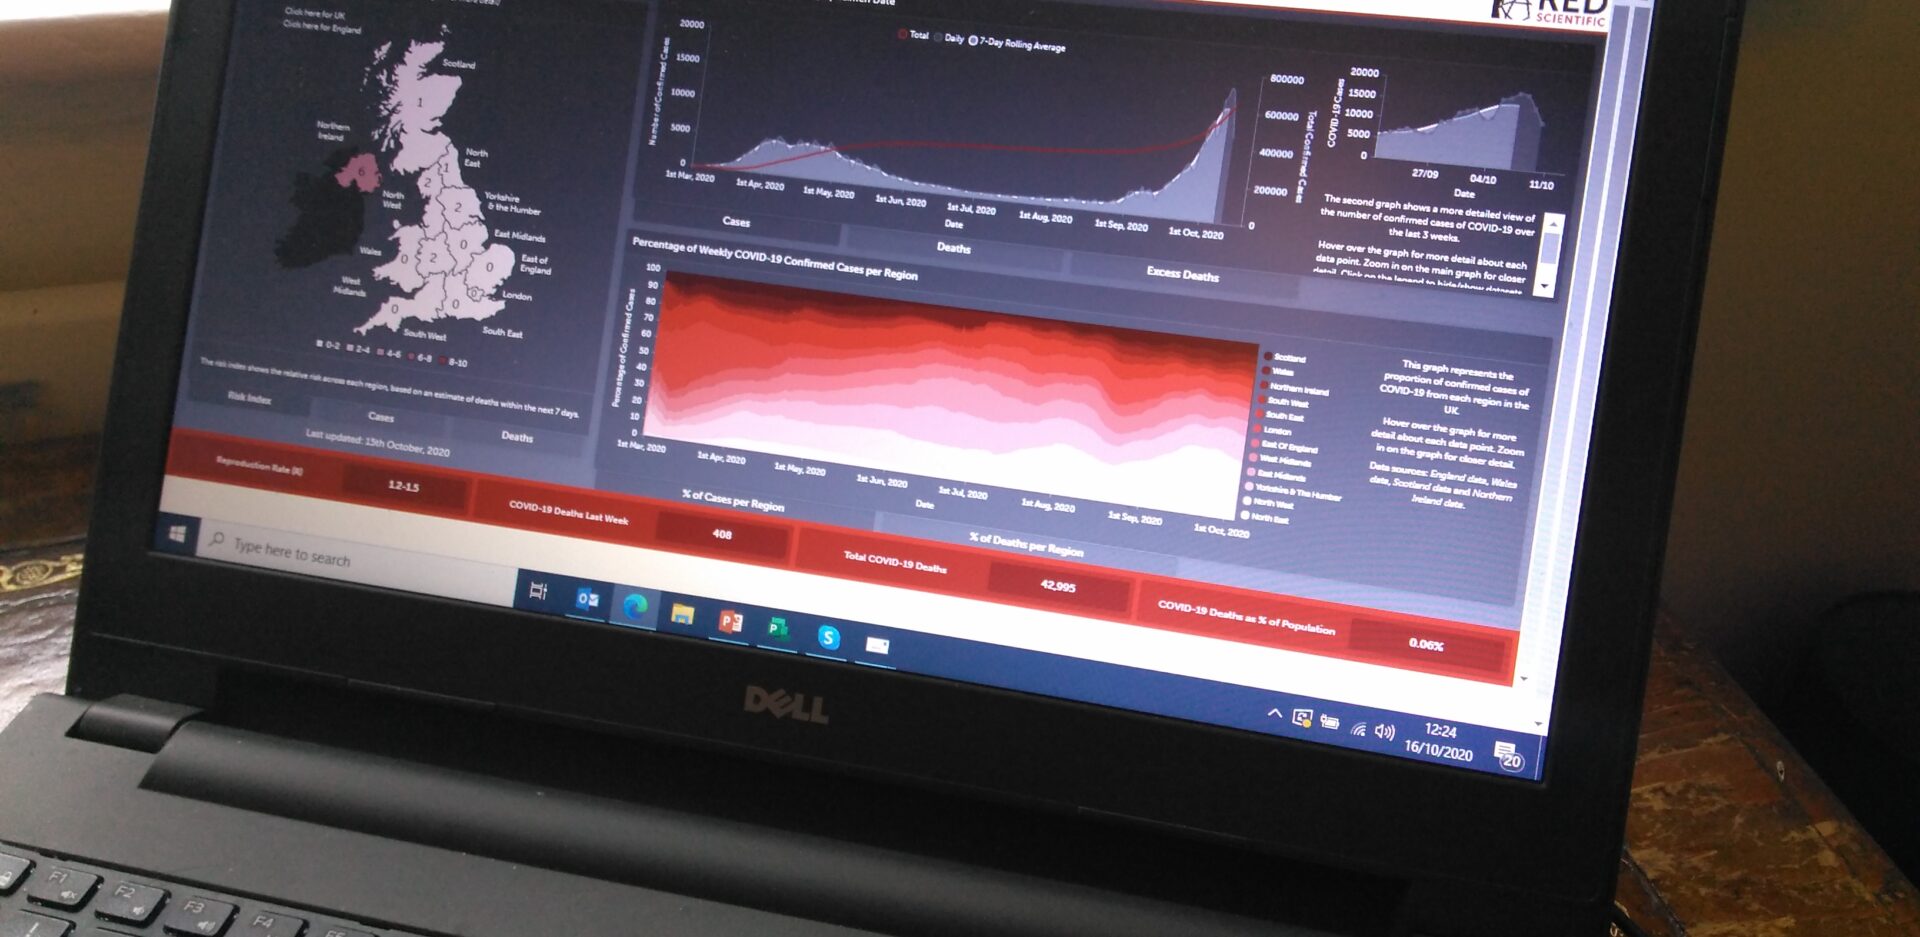
To showcase RED Scientific’s technology, we developed an interactive dashboard that collected and displayed real-time open-source data. This data was harvested from a variety of websites and feeds using RED Scientific’s existing OSINT tools.
We selected the COVID-19 pandemic in the UK as the subject matter due to its:
- High public interest
- Rich and evolving data landscape
- Relevance to a broad audience
Outputs
RED Scientific delivered a fully functional, interactive, and responsive COVID-19 dashboard that updated in real time. It was among the first of its kind during the early stages of the pandemic.
The dashboard served as a proof of concept and a reusable template for tracking other dynamic events and data sources beyond COVID-19.
Although the dashboard has since been retired due to the obsolescence of many data sources, the underlying techniques remain highly relevant for any application requiring the display of live or dynamic data in an accessible and engaging format.
For more information, please contact us at dashboard@red-scientific.co.uk or use our contact form.