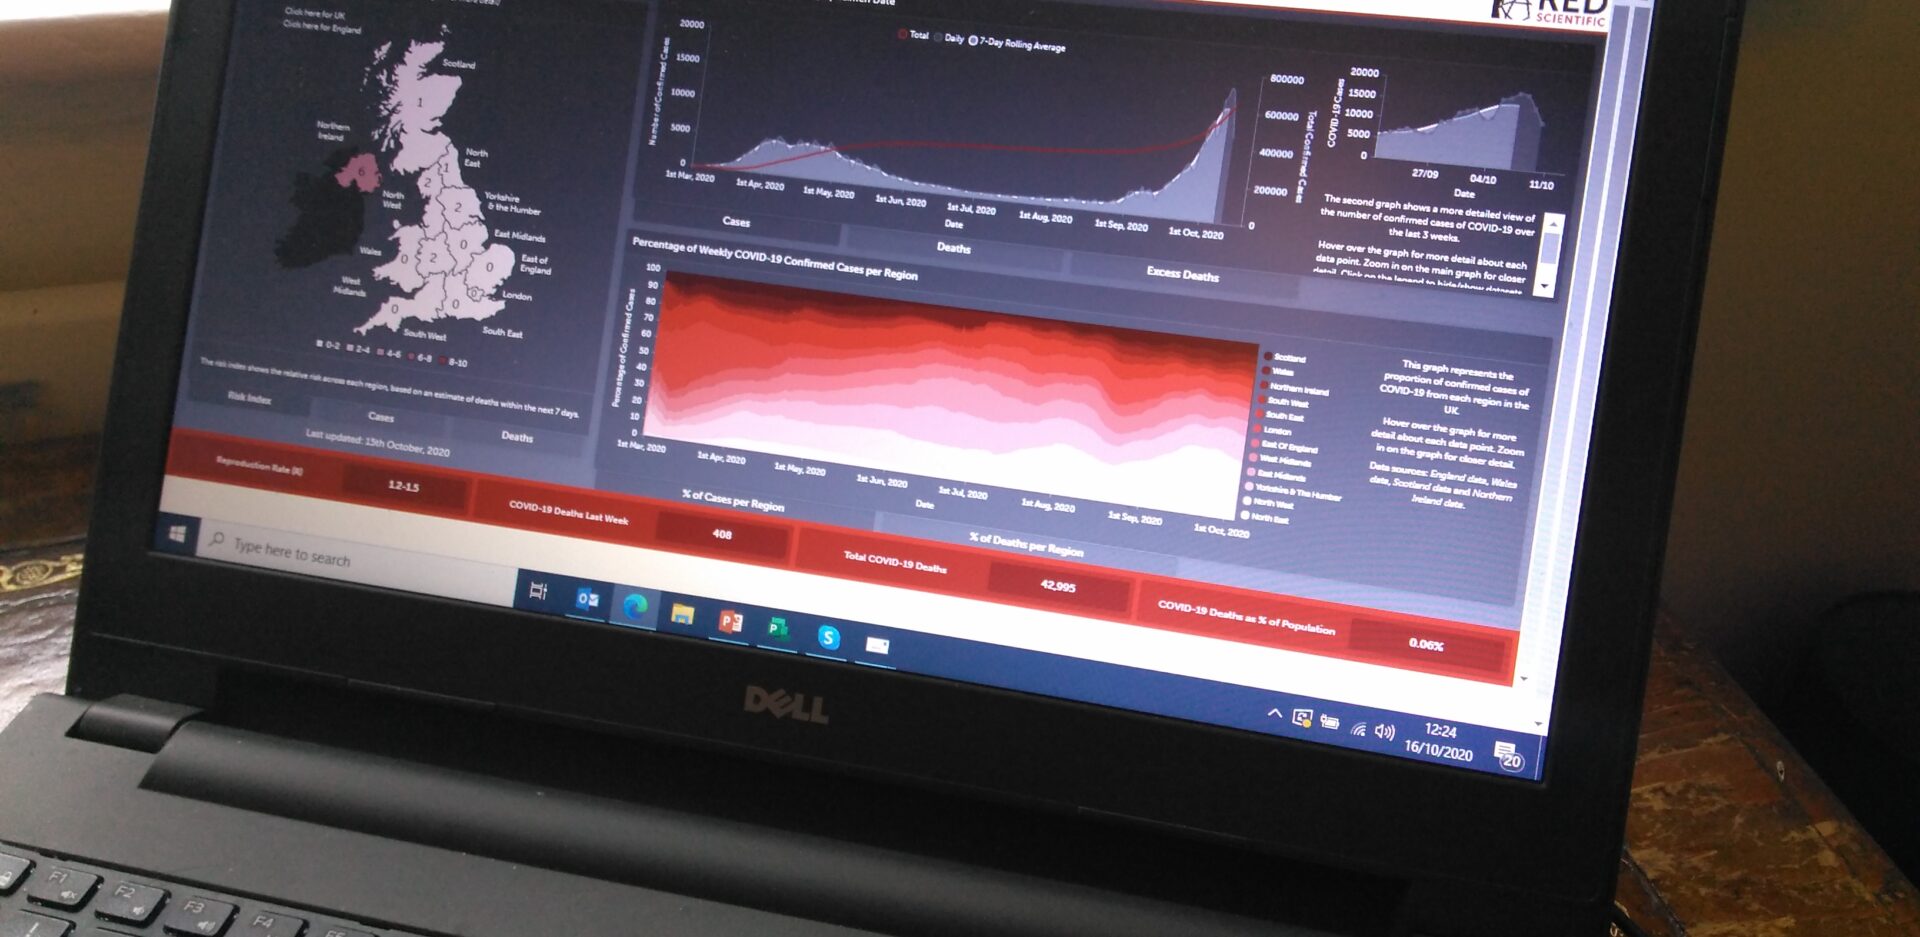
The RED team has published the beta version of a web-based dashboard designed to highlight the risks from COVID-19 across the UK countries and regions (which can be found here). The dashboard acts as a demonstrator for RED’s new service: RED-Vi (Visual Intelligence) – for turning real-time open-source data into insightful visual information.
Uniquely, it updates daily from 12 disparate official data streams to provide a highly interactive graphical view of key COVID trends. It is expected to be of interest to those looking for a clear visual presentation of regional level risk. Future developments will add more health-related data streams, and extend beyond that to include environmental, social and economic impacts of the pandemic.
MD Yvonne Whiteley said, “This has been a challenging project, not just in creating powerful visualisations but also in harvesting, checking, cleaning and consolidating data from multiple sources. I hope that those keen to understand the UK COVID picture will find the dashboard useful. We welcome suggestions for how it could be improved and for other applications of the technique.”
To find out more please email us at dashboard@red-scientific.co.uk or via the Contact RED page.